


We rebuilt this website from the ground up in 2024. Eighteen months later we pointed our own Website Analyzer at it, mostly expecting a victory lap.
It came back a C−.
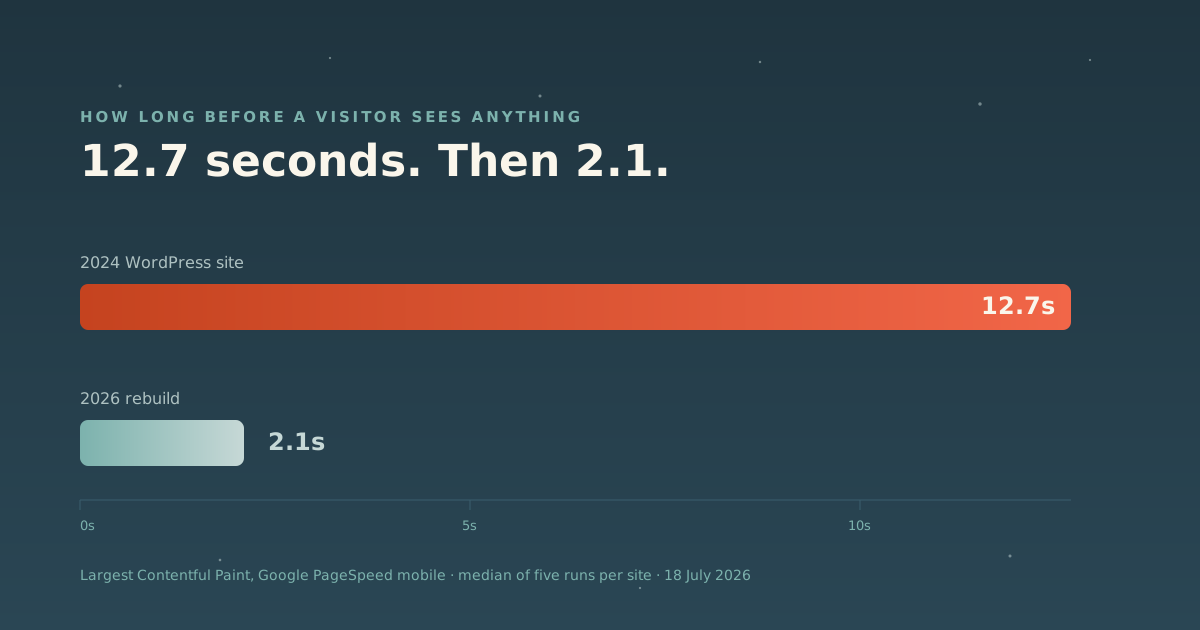
The instinct in that moment is to argue with the tool. We didn’t, because the part of the grade that stung was the part Google measures directly, and you cannot argue with a stopwatch: on a phone, our main content took 12.7 seconds to appear.
Here is everything we changed, including one fix that made things measurably worse.
What a C− actually consisted of
The grade spans six dimensions. Two of them, performance and accessibility, are measured by Google’s Lighthouse rather than judged. Those were the ones that hurt:
| 2024 site | |
|---|---|
| Largest paint | 12.7s |
| Blocking time | 354ms (up to 645ms) |
| Performance | 53 |
| Accessibility | 80, six real failures |
A note on that C−, since we are asking you to trust these numbers. It is our measurement of the 2024 site on 18 July 2026, and the old site is still live until we cut over, so you can check it yourself. Grade it today and you may see a C rather than a C−: Lighthouse simulates a device, and on a site this slow the performance score swings by more than ten points between runs. That wobble is why the rest of this article leads with the numbers that did not move.
The other four dimensions (search and answer-engine readiness, design, conversion, trust) came back mediocre for a different reason. The site was built for how websites were judged in 2024. Since then, answer engines started reading pages rather than merely ranking them, and ours gave them almost nothing to read.
Fix one: get the marketing tags off the main thread
The diagnosis mattered more than the fix here, so it’s worth showing the reasoning.
Our own assets were lean: about 9KB of CSS, first paint at 1.7s. But largest paint and time-to-interactive were identical at 12.7 seconds. That signature is specific: the page paints something quickly, then JavaScript seizes the main thread and nothing else can happen. It is not an image problem, and compressing images (the advice most speed tools lead with) would have done nothing.
The culprit was the Google Tag Manager container. Our code ships only the container snippet; analytics and ads tags load inside it, managed in GTM’s own interface. Together that was roughly 472KB and about 800ms of main-thread execution before the browser could get back to drawing the page.
The fix was Partytown, which relocates third-party scripts into a web worker, a separate thread. The tags still run, still fire, still report. They just no longer hold the page hostage.
<!-- The container snippet, retyped so it runs off the main thread -->
<script type="text/partytown">
  (function (w, d, s, l, i) { /* standard GTM snippet */ })
  (window, document, "script", "dataLayer", "GTM-XXXXXXX");
</script>
Blocking time went from ~590ms to 0ms.
One warning, because this is where people get burned: moving ads tags into a worker is exactly the scenario where conversion tracking silently breaks. We did not assume it survived. We loaded the deployed site and confirmed that analytics page views and every ads conversion beacon still fired from the worker. Verify yours specifically.
Fix two: stop shipping work the first screen doesn’t need
Less dramatic, still worth points:
- Defer heavy interactive components. Our animated homepage constellation cost about 578ms to hydrate. Its server-rendered markup is already a complete, correct graphic, so deferring hydration until the browser is idle is invisible to visitors.
- Preload the fonts the heading actually uses, so the largest text paints in its real typeface instead of waiting for CSS parsing to discover it.
- Stop decoding a 26-megapixel logo into a 148-pixel slot. Our footer mark was 5001×5236. It is now 573×600.
- Delete what nothing references. Roughly 70MB of orphaned imagery, zero references.
The fix that made it worse
We inlined the CSS, on a reasonable theory about eliminating a render-blocking request.
Performance fell from 97 to 74. Blocking time went from 0ms back to 965ms, and first paint got slower, not faster.
We reverted it within the hour. The theory was sound and the measurement disagreed, so the measurement won. We’re including this because case studies that present a straight line from problem to solution are lying about how the work goes, and because it is the single best argument for measuring after every change rather than batching up a dozen “improvements” and hoping.
Fix three: write for the machines that now read pages
Ranking and being quoted are different problems. An answer engine needs to find a direct answer in plain language and know what your organisation is.
So every significant page got structured data: an entity graph describing the organisation, the services offered, the people behind them, and the questions each page answers. And we wrote actual answers, in the page, in the words people use when they ask. Not gated behind a form or a sales call.
A detail worth stealing: our FAQ component emits its structured data from the same array that renders the visible text. They cannot drift apart, because there is only one source. A machine-readable answer that contradicts the visible page is worse than no markup at all.
Fix four: accessibility, properly
Six automated failures, all resolved:
- Contrast. Our primary button (white on our brand coral) measured 3.1:1, under the 4.5:1 minimum. That meant changing a brand colour, not a stylesheet value, so the coral got deeper (5:1) for this measurement. It did not stay that way, and the note below explains why.
- Keyboard access. The interactive service constellation opened its cards via a
JavaScript class applied on hover, so keyboard users got a focus ring and no
content. A CSS
:focus-withinrule now reveals the same cards with no JavaScript at all, which also fixes it for anyone whose scripts fail to load. - Motion. Ambient animation is disabled outright under
prefers-reduced-motion.
Result: 100/100, zero failures.
Then one of those fixes lost an argument with the brand. Shortly after this measurement we put the original coral back on primary buttons: the deeper shade was accessible, but it was no longer the colour our brand is recognised by. That is a deliberate trade, and it costs contrast. White on brand coral is 3.1:1, which clears AA for large text and misses the 4.5:1 for normal text, so an automated audit today scores accessibility 96, with button contrast the only flag (Lighthouse, mobile, 15 September 2026). We would rather publish that than keep claiming a 100 we no longer hold. Our accessibility statement says the same: AA is our design target, not a guarantee.
Where it landed
Median of five Google PageSpeed mobile runs per site, measured 18 July 2026:
| 2024 site | 2026 rebuild | |
|---|---|---|
| Largest paint | 12.7s | 2.1s |
| Blocking time | 354ms | 0ms |
| Performance | 53 | 97 |
| Accessibility | 80 (6 failures) | 100 (none) |
Our analyzer now grades the rebuild an A, and what it still flags are strategy questions rather than defects: whether to publish starting prices, whether the hero should carry one call to action or two. The full before-and-after is written up as a case study.
The question underneath all of this: WordPress
The old site was WordPress, built with a page builder. The new one is Astro. That is the change beneath every number above, and it is the thing we get asked about most. So, plainly, and against our own interest in sounding brave:
We build a lot of WordPress sites, and for most clients it is still the right call. When a team needs to edit every page themselves without calling us, when the plugin ecosystem does in an afternoon what would otherwise be a month of custom work, when the people who will run the site already know the admin, WordPress wins, and we will recommend it. It is on our own toolkit shelf for exactly that reason.
What is slow is rarely WordPress itself. It is what accumulates on top of it. A page builder ships its entire layout engine to every visitor. A form plugin loads its scripts on pages that have no form. Each addition is individually reasonable and the total is a homepage that spends twelve seconds assembling itself on a phone. Ours was running WPBakery, and the old site is still live, so you can view source and count the requests.
We chose differently for ourselves because our own site has an unusual job: it has to be the argument. Three things mattered more to us than editing convenience.
Answer engines have to be able to read it. Structured data, plain-language answers, and a page that renders without waiting on JavaScript are now what decides whether an AI cites you at all. It’s the work we describe on the SEO & AEO side of the business.
Speed is an accessibility problem, not a vanity metric. Most of the world meets the web on a mid-range phone over an uneven connection. A twelve-second page is not slow for them, it is unusable.
Fewer moving parts. The rebuild replaced a stack of plugins with one system we own end to end. It’s the same argument as the Lean Stack: not avoiding tools, just needing a handful instead of a dozen.
None of that makes WordPress wrong. It makes it the wrong fit for this particular site, which is a much narrower claim, and the only one we can honestly make. If the question you came with is whether your WordPress site can be made fast, that has its own answer: how to optimize your website for speed.
Two things we won’t pretend
Scores move. Lighthouse simulates a device, so results vary run to run: the old site measured 42 to 56, the new one 92 to 99. Accessibility and blocking time were identical on every run, which is why those lead the table. If a vendor quotes you a performance score to the decimal point, they are overselling a noisy number.
This was a rebuild, not a tune-up. We are not claiming you can take a 12.7-second site to 2.1 seconds by adjusting settings. Partytown alone would have helped any site, including the old one, but the rest came from building differently.
The uncomfortable part is the useful part: a site can be eighteen months old, look completely fine, and still be failing the measurements that now decide whether anyone finds it. The only way to know is to measure.