


The uncomfortable version of our own story: we rebuilt this website in 2024, and by 2026 our own AI diagnostic graded it a C−. Rather than quietly fix it, we ran the whole thing in public: measured the old site, rebuilt for how sites are judged now, and measured again. On a phone the page now shows up in 2.1 seconds instead of 12.7, it responds to taps instantly, and six accessibility failures went to none (button contrast is back by choice, explained inside). The tool that graded us, our Website Analyzer, is one of the AI systems now built into the site, alongside an AI concierge and an AI launch planner.
← All workOur own house · Brand & Growth Agency
Peaceful Media
We put our own site through the grader, and rebuilt it when it came back a C−
- 12.7s → 2.1stime until the page actually shows up on a phone
- 354ms → 0mstime the page ignores taps while it loads
- 80 → 100accessibility, six failures to none (18 July 2026)
- 53 → 97Google performance score (mobile)
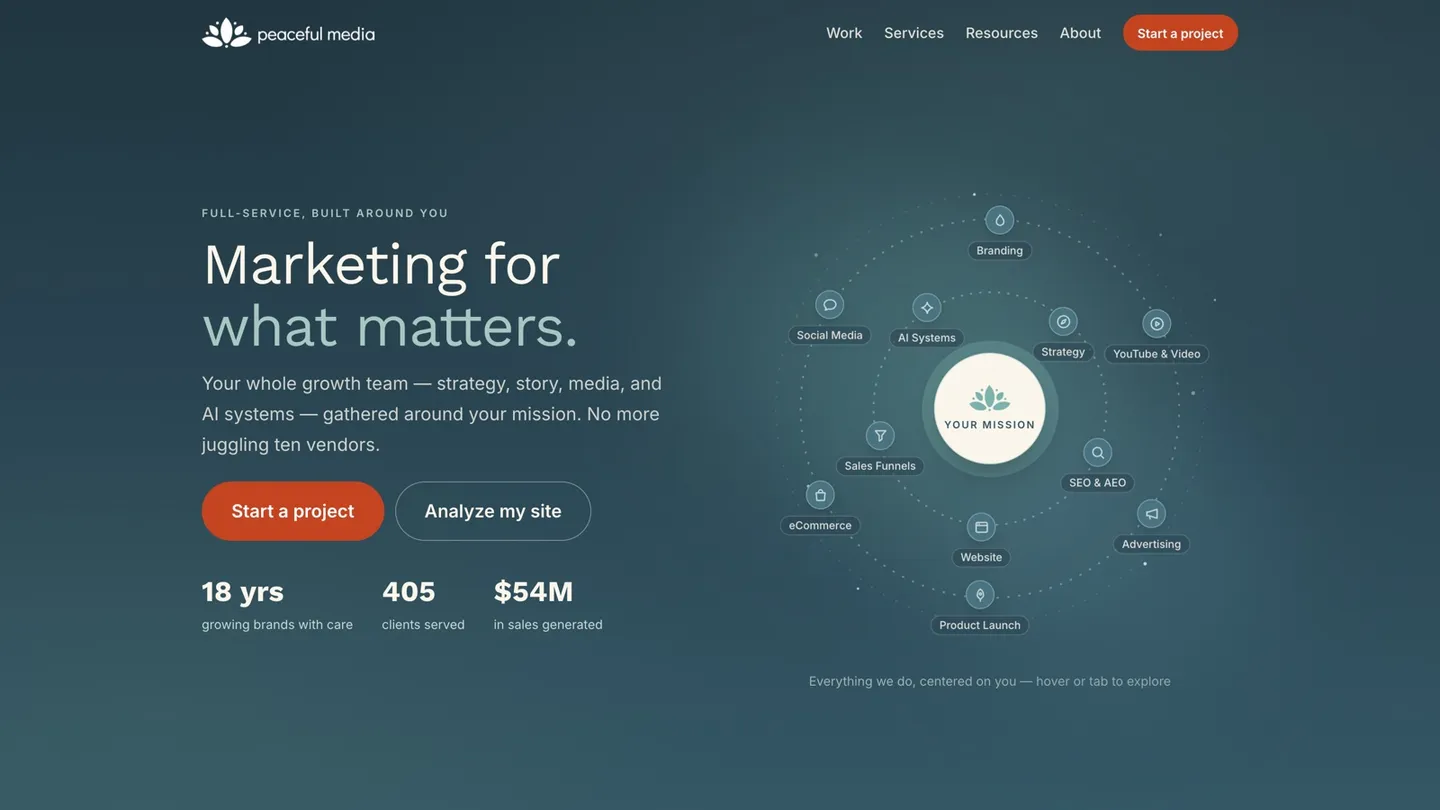
A few pieces from the work
The full story
Case study details
This is the one case study where we are the client, so treat every number here as something you can check yourself. Run peacefulmedia.com through our own Website Analyzer (one of the AI systems we build) and you'll see the old site's score. That's exactly how this project started.
Challenge
We had rebuilt our website from the ground up in 2024. It looked good. It was not old. And when we pointed our own Website Analyzer at it, it came back a C−.
That’s uncomfortable for a marketing agency to publish, so here’s the honest version of why it happened. The 2024 build was made for how websites were judged in 2024. In the eighteen months since, three things moved underneath it:
- Answer engines started reading sites instead of ranking them. ChatGPT, Perplexity and Google’s AI Overviews quote pages that answer a question directly and carry machine-readable structure. Our site had neither.
- Core Web Vitals stopped being a technical footnote. Google measures a real phone on a real connection. Ours took 12.7 seconds to show its main content. Most visitors never waited.
- Accessibility became a floor, not a nice-to-have. An automated audit found six genuine failures: buttons and links with no accessible name, insufficient contrast, out-of-order headings.
None of that shows up when you look at a site. It only shows up when you measure it.
The plan
We treated our own site the way we treat a client’s: measure first, fix what the measurement actually says, then measure again.
Make it fast on a phone, not on a laptop. The largest single cost was JavaScript occupying the main thread: the marketing tag stack alone ran roughly 800ms of script before the page could finish loading. Moving that work into a web worker, a background lane in the browser, stopped the page ignoring taps without losing a single conversion tag. The rest was unglamorous: defer what the first screen doesn’t need, preload the two fonts it does, and stop shipping a 26-megapixel logo into a 148-pixel slot.
Write for the machines that now read pages. Every service page, the homepage, the tools and the podcast got structured data describing what they are. Questions people ask got plain-language answers on the page, in the words a person would use, not buried in a PDF or a sales call.
Fix accessibility properly rather than cosmetically. Every automated failure was resolved, including the one that required changing a brand colour: our primary button did not meet contrast minimums, so the coral got deeper for the audit. That one did not last, and the caveats under Results say why. Keyboard users can now reach the interactive service constellation that previously only opened on hover.
Results
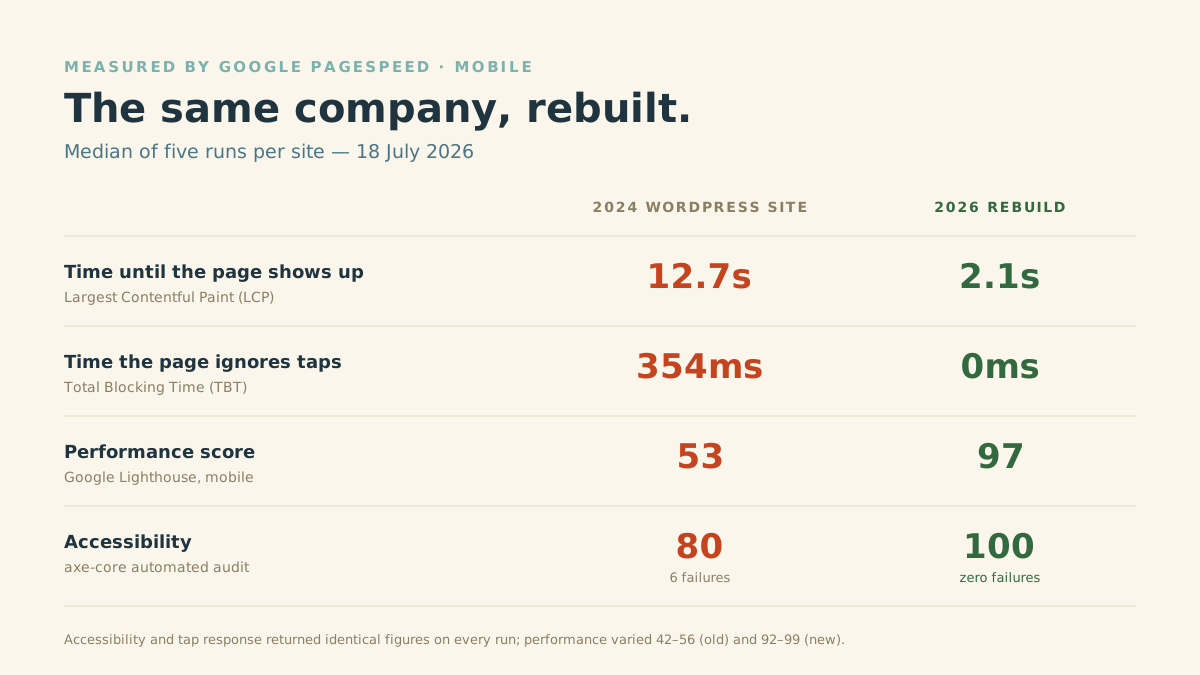
Measured with Google PageSpeed on mobile, median of five runs per site, on 18 July 2026:
- Time until the page shows up: 12.7s → 2.1s. Google calls it Largest Contentful Paint, and it’s the single number that decides whether a visitor stays.
- Time the page ignores taps: 354ms → 0ms. Google calls it Total Blocking Time. The page now responds to a tap immediately.
- Performance score: 53 → 97.
- Accessibility: 80 → 100, with six real failures resolved and none introduced.
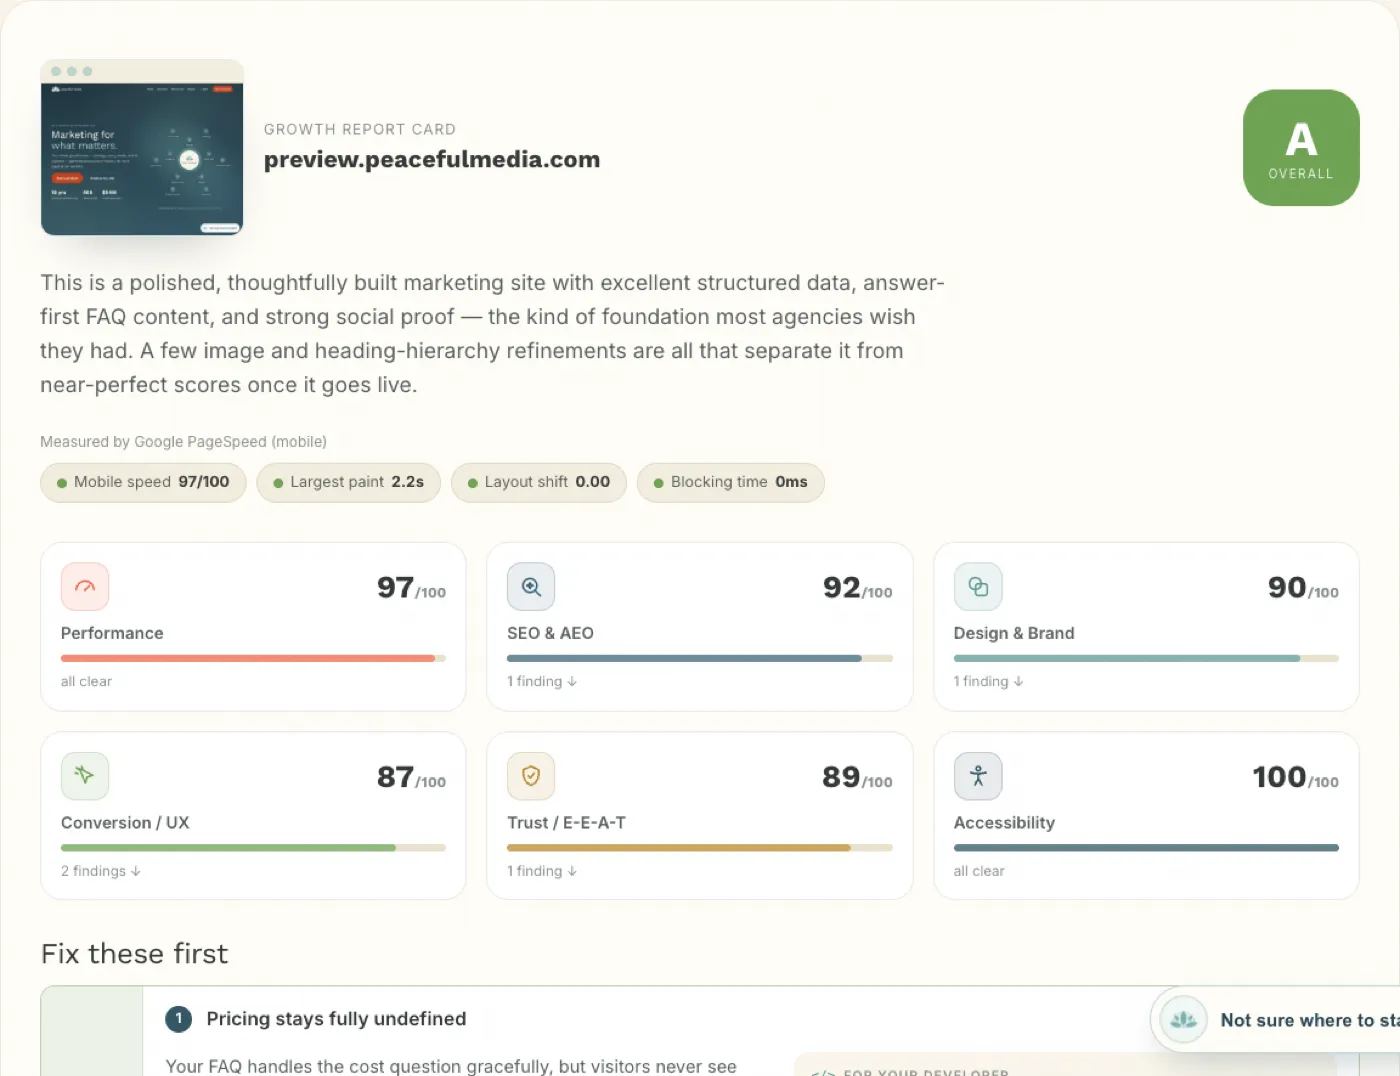
Our own analyzer now grades the rebuilt site an A, and its remaining notes are strategy questions rather than defects: whether to publish starting prices, whether the hero should carry one call to action or two.
Three honest caveats, because a case study without them is marketing. First, performance scores vary between runs: the old site measured anywhere from 42 to 56, the new one 92 to 99. Accessibility and tap response were identical on every run, which is why we lead with those, and why grading the old site yourself today may show a C rather than the C− we captured. Second, this was a rebuild, not a tune-up; we’re not claiming these numbers come from optimising the existing site. Third, one of those accessibility fixes did not last: shortly after this measurement we put the original coral back on primary buttons, because the deeper shade was no longer the colour our brand is recognised by. White on brand coral is 3.1:1, which clears AA for large text and misses the 4.5:1 for normal text, so an automated audit today scores accessibility 96, with button contrast the only flag. We would rather publish that trade than keep the 100.
The AI systems we built in
There’s a reason this case study is tagged AI systems: the tool that graded us is one. Our Website Analyzer pulls a page plus real Google PageSpeed data, then has an AI model reason over a fixed six-part rubric (performance, SEO/AEO, design, conversion, trust and accessibility) and write back a plain-language report card with the three fixes that matter most. Graded by AI, prioritized by humans; because the rubric never changes, two runs are comparable rather than a random opinion.
It’s not the only one on the site. A visitor can ask our AI concierge a question and get an answer in context, or build a dated, personalized plan with the AI Launch Planner and keep working it at a private link. All three follow our rule for clients: the model does the reasoning, a human sets the rubric and owns the call. The site you’re reading is the reference build for the AI systems we put into our clients’ sites.
Keep readingBrowse all work
 Previous storyExit Strategy Coach7 days from lead-gen tool to real revenue
 Next storyHeart of the Customer+100% organic traffic recovered
Want results like these for your mission?
Start a project